Cooking the Books
What happens to a market if everyone makes the same decisions? When do obvious choices lead to less-than-obvious outcomes for investors?
Index investing has become so popular over the years that we are beginning to see some rather interesting paradoxes. Specifically, those stocks that are held in popular large-cap indexes, such as the S&P 500 and the Dow Jones Industrial Average, have been performing better than the average investor.
Yet, that same outperformance is also leading to higher levels of potential risk in so-called "safe stocks."
Start with a Basic Recipe
The S&P 500 is an example of a capitalization-weighted index. The recipe is simple. Take 500 of largest companies in our country. Big companies get a bigger slice of the pie (proportional to size). Right now, the largest slices belong to Apple, Microsoft and Exxon Mobil.
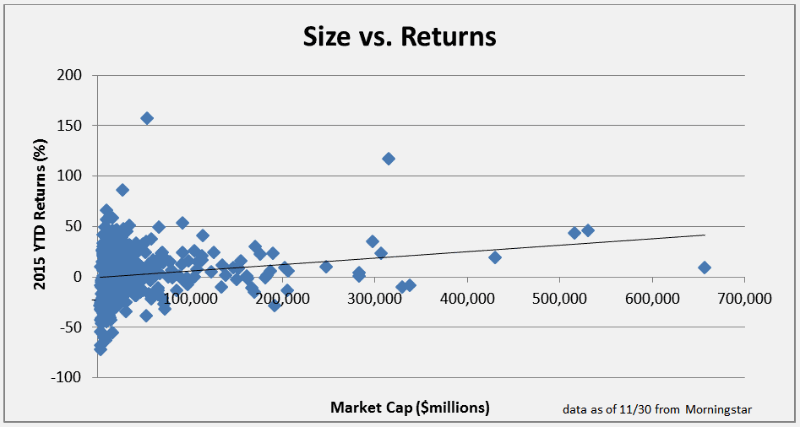
The chart below summarizes the relationship between company size and returns this year. It appears that bigger really is better.

Size vs. Returns
Year-to-date through November 30th, the S&P 500 Total Return Index is up 3.0%. People are all making money, right? Well, yes and no. The ratio of stocks with gains to those with losses is very close to 1:1.
Ranked by performance, the top 20 stocks in the index have gained an average of +61%. The remaining 480 stocks in the index have lost an average of -0.5%.
To make things simpler, just six large-cap companies have contributed all of the gains for the S&P 500 this year. These include Amazon, Alphabet (formerly Google), Facebook, Microsoft, GE, and Apple.
Original Recipe, Fewer Ingredients
Just for fun, let's build a fictional "enhanced" index of the largest companies in the S&P 500. We'll "double down" on companies based on market cap (company size) as of the beginning of this year. So, instead of a weighting of 3.1%, Apple would have a weight of 6.2% in the new index. Big companies now get an even bigger slice of the pie.
Our hypothetical "double down" index would have generated 10.7% returns since last year, beating the "unenhanced" S&P 500 by a margin of almost eight percentage points. Not too shabby!
This partially explains why any attempt to diversify from large U.S. companies has led to reduced returns, and how the average investor has not been able to "keep up with the market."
Paying More For Less
If most stocks are comparatively flat, does it make sense to reduce risk by holding historically safer stocks? Again, the answer is yes and no.
The S&P 500 Low Volatility ETF holds 100 of the least volatile companies from the S&P 500. Less volatile stocks get a bigger piece of the pie than slightly more volatile stocks. Sounds like a good recipe for safety, doesn't it?
This approach has outperformed the standard S&P 500 during each of the past five years. However, based on standard valuation metrics (P/E multiples), low-volatility stocks are trading at a 31% premium to their peers. To a certain degree, market risk is being replaced by valuation risk.
We need to ask "are investors overpaying for stability?" Michael Rawson at Morningstar reports that, "the sudden interest in low-volatility strategies may presage lower risk-adjusted returns for the strategy going forward."
Something Isn't Tasting Right
If investors overpay for stability, it suggests a lack of confidence in the future. Markets have proven even the most skeptical investors wrong in the past, but the absence of across-the-board gains would indicate that U.S. stocks may actually be weaker than they appear at first glance.
We've had a similar situation in 2001, when a narrow list of companies was responsible for the bulk of investor returns. Market technicians refer to this phenomenon as having "bad breadth", which suggests that we should all soon be changing our conversations.
Jim Lee, CFA, CMT, CFP®
Founder, StratFI
Disclosure: All data as of November 30, 2015. Information contained herein is for educational purposes only and is not to be considered a recommendation to buy or sell any security or investment advice. Securities listed herein are for illustrative purposes only and are not to be considered a recommendation.
